

Find the Right Return on Investment Analysis Template
Need a spreadsheet you can use now? Start with a general investment analysis template for projects with costs and cash flows over time. For a healthcare quality program, use the Medicaid ROI template, which supports before-and-after and comparison-group analysis.
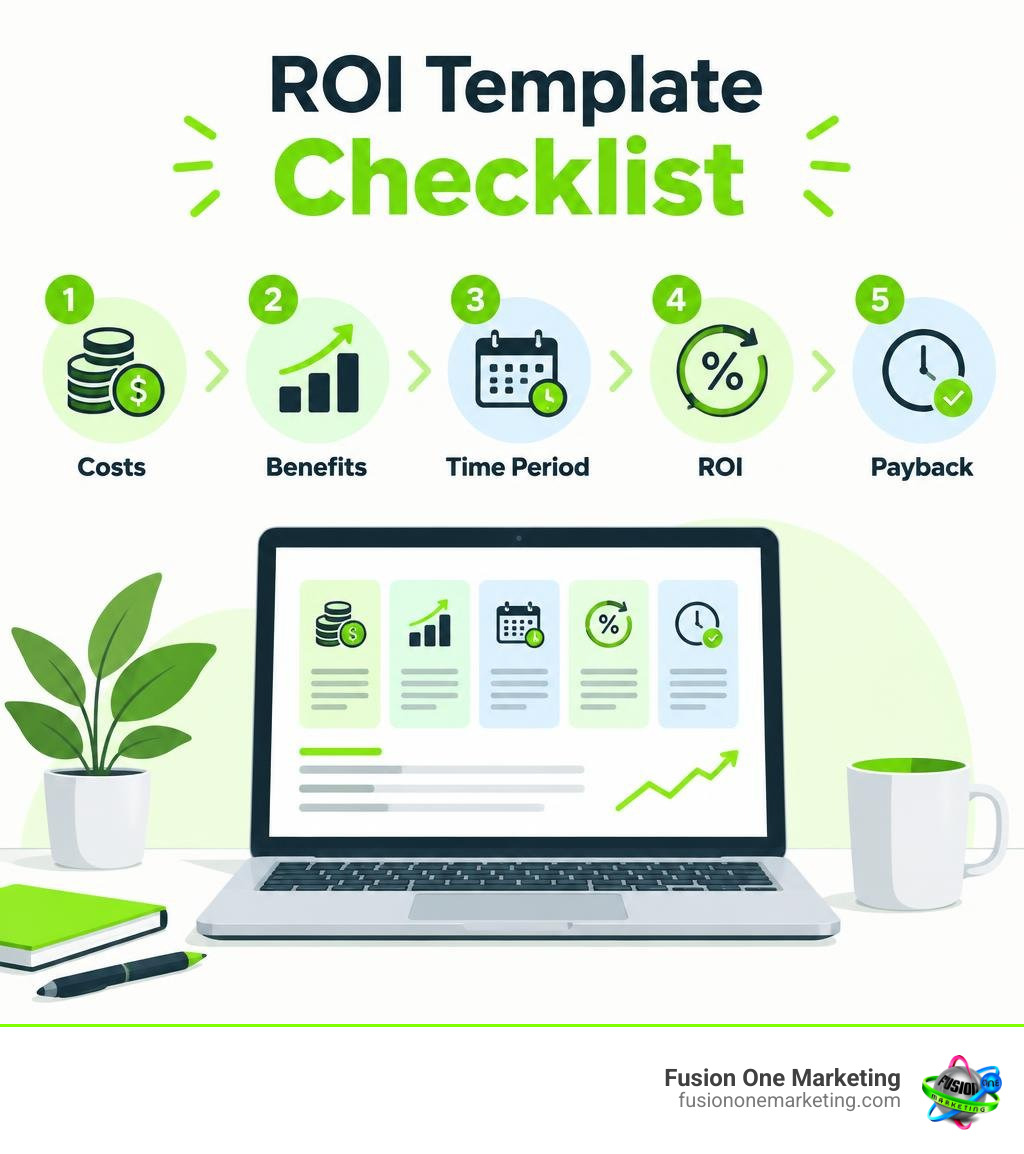
Whichever template you choose, enter all costs, the benefits you can measure, and the time period. Then check ROI alongside payback time and the assumptions behind your numbers. For a home service business, that might mean comparing ad spend and staff time with the profit from new jobs, not just the leads an ad brought in.
I’m Rob Humm, an owner of Fusion One Marketing, and I’ve worked in digital marketing since 2011. My work with local search and paid ads helps me show business owners how to use a return on investment analysis template to make sense of their marketing spend.
The article editor does not render LaTeX. Do not write LaTeX commands or math delimiters in article copy. Explain calculations in plain language, or use an ordinary-text formula when useful, such as watts = volts × amps. Write units as readable text, such as ft³/hour or gallons/kWh. When asked to remove formulas or confusing mathematical notation, replace them with prose; do not substitute different equations or hide the notation in code.
Essential Components of a Return on Investment Analysis Template
Every dependable financial model stands on a foundation of clean data architecture. When evaluating any capital budgeting proposal or marketing initiative, a simple percentage cannot tell the whole story without granular context. To perform a rigorous investment appraisal, an evaluation workbook must track both hard cash movements and structural variables across time. A definitive explanation of ROI metrics establishes that the metric is fundamentally a ratio comparing net profit to total invested capital: ROI = (Net Profit / Total Investment) * 100.

To build a reliable evaluation model, you need to understand how different financial metrics interact within a multi-tab workbook:
| Evaluation Metric | Primary Formula / Logic | Best Use Case | Key Strength | Main Limitation |
|---|---|---|---|---|
| Simple ROI | (Net Gain / Total Cost) * 100 | Single-period campaigns, quick comparisons | Easy to calculate and explain to stakeholders | Ignores time horizon and cash timing |
| Annualized ROI | [(1 + ROI)^(1 / Years)] – 1 | Multi-year capital investments | Normalizes returns across uneven durations | Assumes constant compounding rate |
| Net Present Value (NPV) | Sum of [Cash Flow / (1 + r)^t] – Initial Cost | Long-term asset purchases, complex projects | Incorporates discount rates and time value of money | Requires accurate cost of capital (WACC) |
| Internal Rate of Return (IRR) | Discount rate where NPV equals zero | Capital budgeting, project prioritization | Shows project yield as an absolute percentage hurdle | Can produce multiple values with erratic cash flows |
Direct and Indirect Cost Breakdown Fields
The most frequent mistake in financial modeling is omitting indirect expenses. Calculating returns based solely on upfront software licensing or ad platform fees produces artificially inflated returns. A complete return on investment analysis template breaks expenditures into clear operational buckets:
- Capital Expenditures (CapEx): Upfront hardware purchases, bespoke software development, physical facility upgrades, and tangible assets depreciated over multiple years.
- Operational Expenses (OpEx): Recurring platform subscriptions, cloud computing usage fees, domain maintenance, and ongoing administrative overhead.
- Labor Allocation and Staff Time: Direct internal team hours devoted to implementation, training workshops, and management oversight. Failing to monetize internal payroll is the primary cause of phantom profitability.
- Onboarding Disruption and Transition Costs: Lost productivity during system migration, temporary efficiency drops, and external implementation consultant fees.
- Cost Avoidance: Quantifiable expenses prevented in future operating cycles, such as reduced compliance penalties, lower server maintenance costs, or eliminated third-party agency retainers.
Cash Flow Timing and Payback Period Calculations
Returns rarely arrive in a neat, uniform stream. Tracking monthly net cash flow allows you to determine the exact break-even month, which is the milestone where cumulative gross savings and revenue exceed total capital outlays.
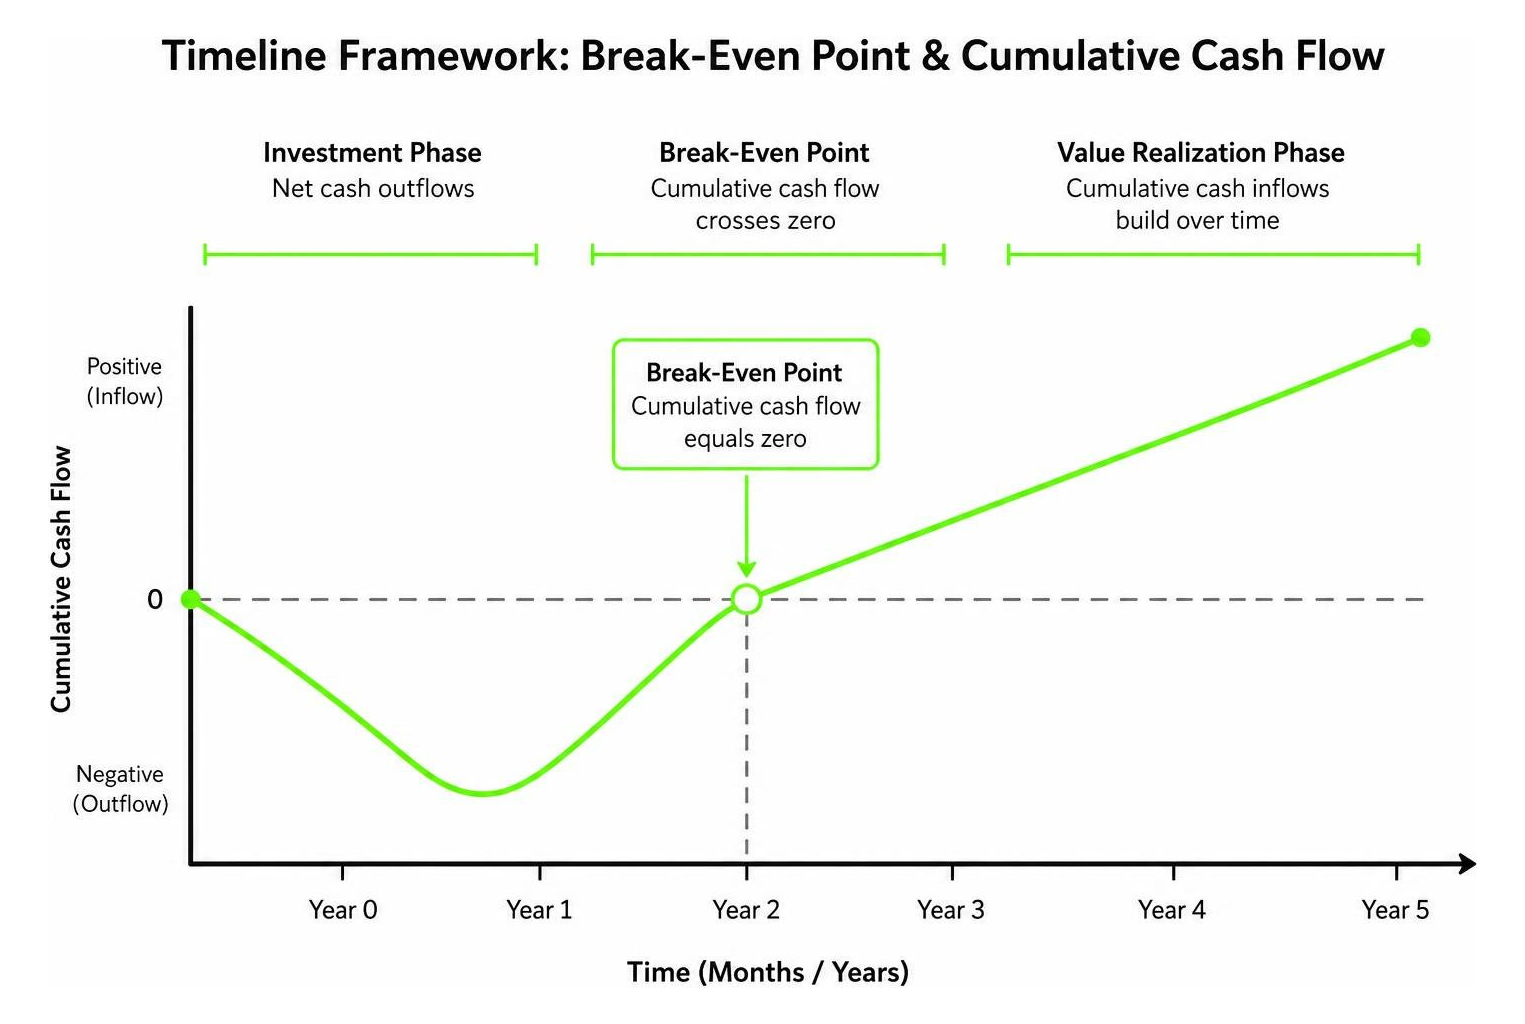
A five-year time horizon requires modeling initial net-negative cash positions followed by expanding margins. Your model should factor in the holding period of equipment or software, along with any expected salvage value or terminal asset recovery at the conclusion of the project lifecycle.
Advanced Financial Metrics: Simple ROI vs NPV and IRR
While executive summaries often highlight simple ROI, enterprise capital allocation demands discounted cash flow metrics. Money received three years from today does not carry the same purchasing power as capital deployed today.
By applying a discount rate derived from your Weighted Average Cost of Capital (WACC) or a corporate hurdle rate, Net Present Value calculates the exact dollar value added to the enterprise in today’s currency. For complex acquisitions, an advanced investment analysis template pairs NPV with Internal Rate of Return to demonstrate whether a project exceeds standard equity risk premiums.
Top ROI Analysis Templates for Every Business Discipline
Different organizational departments require distinct financial reporting structures. A marketing team tracking cost per acquisition operates on entirely different input variables than a clinical team measuring health outcomes or an IT department deploying enterprise software.
Digital Marketing and Paid Ad Return on Investment Analysis Template
Digital advertising models must track conversion pathways from impression to cash collected. If your team manages paid campaigns, an effective marketing template integrates customer acquisition cost (CAC), lead-to-deal conversion rates, and customer lifetime value (LTV).
When you evaluate campaign performance, start by reviewing our guide on making ads that convert to ensure your creative foundations produce measurable customer volume. From there, tracking channel profitability requires understanding structural media expenses using our guide to cost per click ad costs.
Research from industry tracking studies highlights that between 60 to 70 percent of marketing content goes completely unused. That wasted spend directly degrades aggregate returns. To fix this leak, examine your conversion funnels alongside our detailed campaign landing page teardowns to maximize traffic efficiency. If you operate in complex e-commerce environments, applying advanced tactics for Amazon Ads CPC bidding ensures ad spend remains tightly aligned with gross margin thresholds.
Healthcare Quality Improvement and Medicaid Return on Investment Analysis Template
Healthcare quality initiatives must prove financial sustainability while improving clinical outcomes. Developed through research supported by the Robert Wood Johnson Foundation and The Commonwealth Fund, The Medicaid Return on Investment Template provides health plans and state agencies with a structured Excel framework for evaluating clinical interventions.
This healthcare model focuses on:
- Pre-Post vs. Comparison Group Analysis: Measuring target population claims against a matched control group to isolate program impact from external trend variations.
- Intervention Cost Capture: Tracking direct care coordination staff, specialized medical equipment, patient outreach materials, and administrative overhead.
- Paid Claims Impact: Categorizing reductions in inpatient admissions, emergency department visits, and prescription drug expenditures over three-year operating cycles.
- Quality Incentive Integration: Incorporating state performance bonuses and value-based shared savings payments into gross revenue calculations.
For hospital systems, pairing this framework with an evidence-based hospital quality toolkit establishes whether preventive care pathways lower overall medical expenses while meeting accreditation standards.
IT Projects and Capital Equipment Investment Models
Software deployments and hardware upgrades carry heavy upfront implementation burdens that produce negative early returns. For example, an enterprise CRM system costing $100,000 might show an initial first-quarter ROI of -68% due to software licensing, migration consultants, and training disruption.
However, enterprise software models frequently yield a median ROI of 278% over a three-to-five-year operational window. An IT investment template tracks the total cost of ownership (TCO) across server depreciation, cloud infrastructure scaling, cybersecurity compliance updates, and recurring maintenance contracts.
Product Development and Feature Prioritization Frameworks
Product teams cannot build every item on a wishlist. An agile product ROI template scores development initiatives before committing engineering resources:
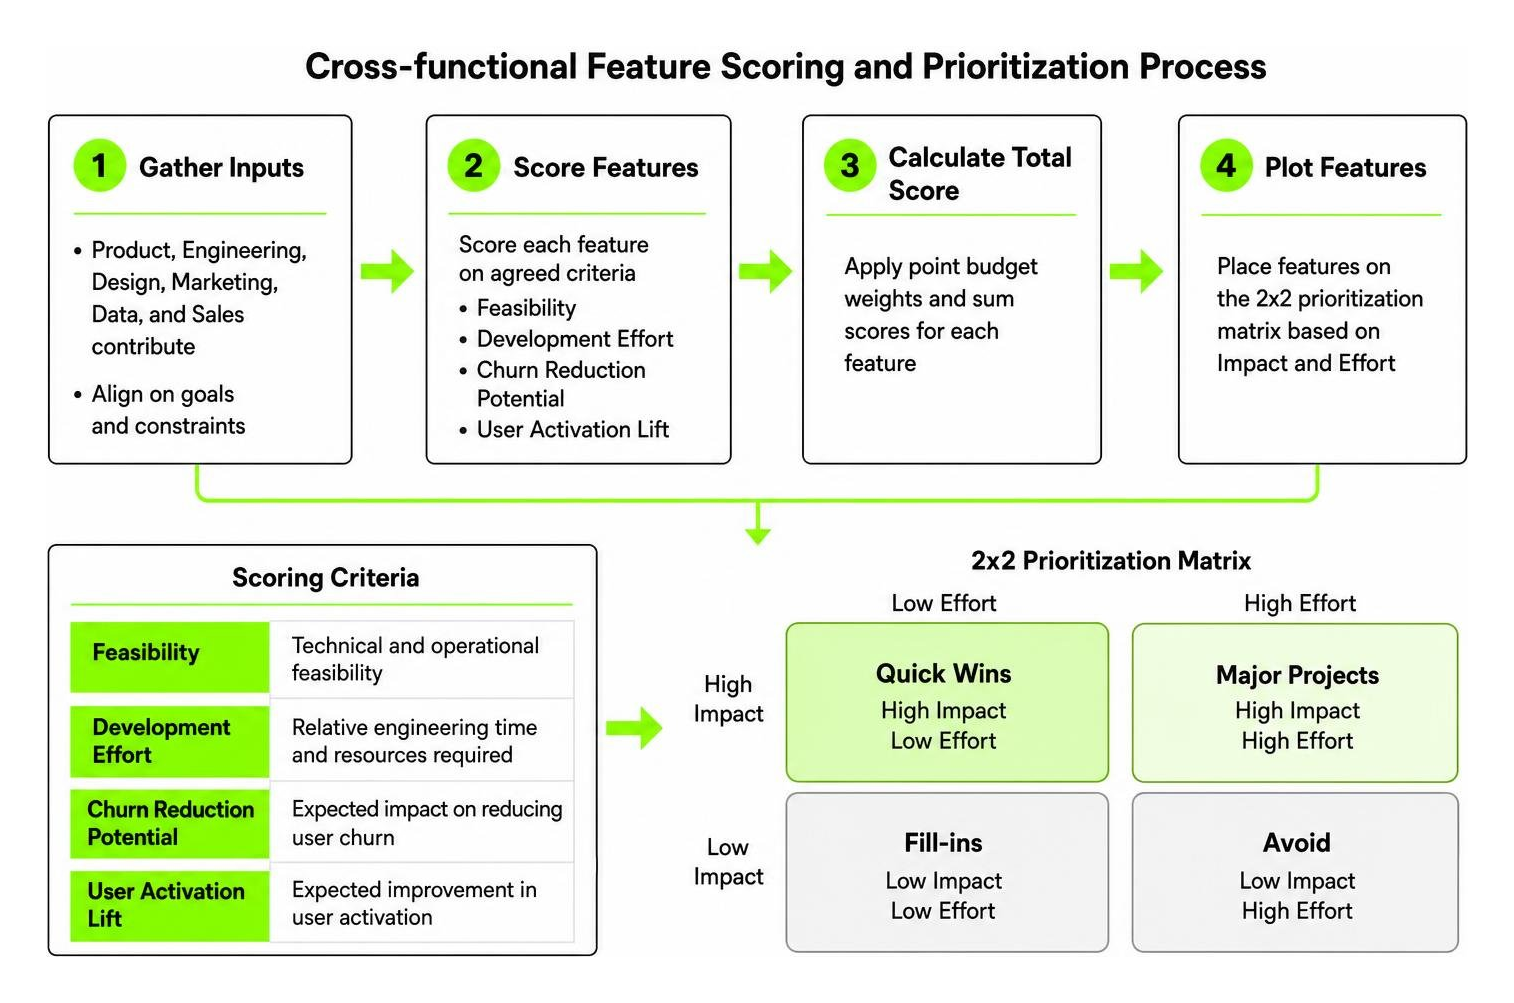
By establishing a strict point budget across feasibility, development effort, churn reduction potential, and user activation lift, product managers can plot initiatives onto a 2×2 prioritization matrix. This ensures engineering sprints focus on high-impact, product-led growth features rather than low-yield requests.
How to Build a Dynamic ROI Calculator in Excel and Google Sheets
A static spreadsheet becomes obsolete the moment project assumptions shift. Building an interactive, dynamic financial model allows decision-makers to adjust variables and immediately review projected financial outcomes.

Setting Up Automated Formulas: IF, SUM, and AVERAGE
Begin by organizing your workbook into dedicated tabs: Inputs, Cost Schedules, Revenue Schedules, and Executive Summary. Maintain raw transactional data in separate columns from calculated fields.
Use these core formulas to automate your model:
- Dynamic Profitability Flag: Use
=IF(D2>0, "Profitable", "Deficit")in your summary rows to automatically label net cash positions. - Cumulative Aggregation: Apply
=SUM(B5:B16)to total annual operating expenditures dynamically across all cost centers. - Performance Benchmarking: Use
=AVERAGE(E2:E20)to compute the mean return across multiple regional marketing campaigns or product initiatives. - Data Validation Dropdowns: Implement dropdown menus for investment categories (e.g., Paid Media, CapEx, Labor, Tooling) to eliminate syntax errors in lookup functions.
Implementing Conditional Formatting and Scenario Modeling
Visual alerts prevent executives from overlooking financial warning signs. Apply rule-based conditional formatting to your ROI percentage column:
- Positive Yields (Green): Values greater than or equal to your corporate hurdle rate (e.g., 20%).
- Marginal Yields (Yellow): Values between 0% and 19.9%.
- Losses (Red): Any negative return, indicating a project operating in a cash deficit.
To evaluate market volatility, build a scenario toggle cell using Data Validation with three choices: Conservative, Base, and Optimistic. Use nested formulas to adjust your projected revenue streams based on the selected scenario, applying a 20% discount for conservative cases and a 15% premium for optimistic forecasts.
Annualized ROI and Hurdle Rate Formulas
When comparing projects of different lengths, simple ROI creates significant distortions. A 50% ROI achieved over three months represents exceptional performance, whereas a 50% ROI over five years equals an annualized return of only 8.45%.
To standardize performance across different holding periods, use the annualized compounding formula in Excel:
If cell D2 contains your simple ROI (expressed as a decimal, such as 0.50) and cell E2 contains the holding period in years (5), the formula =((1+D2)^(1/E2))-1 formatted as a percentage outputs the correct annualized return of 8.45%. Compare this figure directly against your company’s hurdle rate to make clear capital allocation decisions.
Overcoming ROI Limitations with Complementary Decision Frameworks
While return on investment provides an indispensable financial baseline, relying exclusively on a single percentage creates strategic blind spots. A project with an outstanding projected ROI might carry unacceptable execution risk, tie up critical talent, or fail to support broader organizational goals.
Qualitative Scoring: RICE and MoSCoW Prioritization
To prevent spreadsheets from dictating strategy in a vacuum, pair financial modeling with structured qualitative frameworks:
- RICE Scoring (Reach, Impact, Confidence, Effort): Quantifies how many customers an initiative reaches, the qualitative impact on satisfaction, your statistical confidence in the projections, and the internal person-months required for execution.
- MoSCoW Method: Segregates deliverables into Must-haves, Should-haves, Could-haves, and Won’t-haves, ensuring that core infrastructure upgrades receive funding even when immediate direct revenue is difficult to quantify.
Accounting for Intangible Benefits, Risk, and Unequal Cash Flows
Basic financial formulas often fail to capture soft costs and intangible organizational assets:
- Employee Productivity and Morale: Internal process automation reduces repetitive tasks, lowering employee turnover and recruitment costs.
- Brand Equity and Market Authority: Top-of-funnel content marketing builds long-term organic discovery that reduces paid media reliance over time.
- Risk Adjustments: Factoring regulatory compliance risks, cybersecurity exposure, and vendor lock-in safeguards capital reserves.
- Unequal Cash Flows: Applying Internal Rate of Return and Modified Internal Rate of Return (MIRR) accommodates projects where large reinvestments occur in later operational years.
Frequently Asked Questions About ROI Templates
What is considered a strong ROI percentage across standard business benchmarks?
Most established commercial enterprises target a baseline ROI of 10% to 30%, which comfortably exceeds standard corporate cost of capital. A 50% return is widely regarded as strong, generating $1.50 in total gross return for every $1.00 invested. Exceptional software and automation tools frequently achieve returns of 200% to 300%. Conversely, a 1% ROI is rarely worth operational risk unless tied to guaranteed assets like government bonds.
How does annualized ROI differ from simple ROI over multi-year horizons?
Simple ROI calculates the total cumulative percentage gain across an entire project lifecycle regardless of time. Annualized ROI calculates the geometric mean return generated per year. This standardization allows financial controllers to evaluate a 6-month marketing sprint directly against a 5-year facility expansion on an equal basis.
Can an ROI spreadsheet handle risk adjustments and scenario analysis?
Yes. Robust templates incorporate probability weightings and variable sensitivity tables. By assigning likelihood percentages to pessimistic, base, and optimistic outcomes, the model calculates an expected monetary value (EMV) that prevents leadership from making decisions based solely on best-case projections.
Maximize Your Marketing Investment
Executing a reliable investment appraisal transforms guesswork into predictable business growth. Whether you are modeling clinical intervention savings, upgrading enterprise IT architecture, or optimizing paid acquisition funnels, a structured return on investment analysis template ensures that every dollar deployed delivers measurable financial results.
At Fusion One Marketing, we help businesses across Alabama build data-driven campaigns that maximize customer acquisition. By combining targeted local search, high-converting web infrastructure, and strategic paid advertising, we turn marketing investments into compounding revenue. Contact our team today to evaluate your digital strategy and accelerate your business growth.