

How ROI Tools Help You See What Pays Off
ROI tools help you compare what you spend with what you earn or save. For a home service business, the right tool can connect ad costs to booked jobs and profit, not just clicks or leads. Start by choosing one that tracks your real costs, works with your booking or customer records, and shows which efforts bring in paying customers.
A dashboard can show that calls went up. It cannot tell you whether those calls paid off unless it also tracks the jobs and revenue that followed.
I’m Rob Humm, an owner of Fusion One Marketing. Since 2011, I’ve used digital marketing data to help businesses understand where their money goes, and I’ll use that experience to make comparing ROI tools simpler.
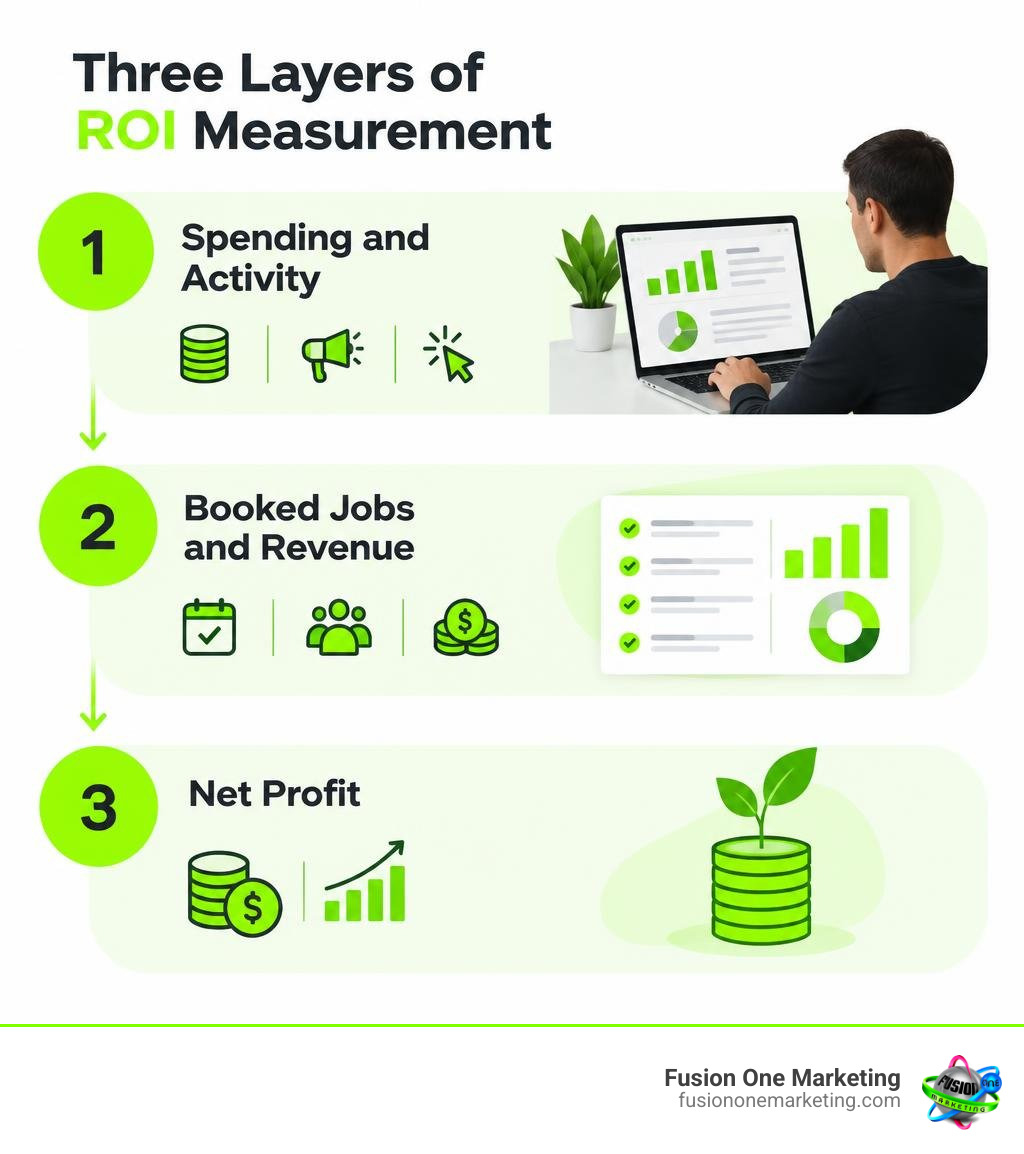
Core Categories of Modern ROI Tools

Not all measurement software serves the same purpose. When evaluating how to track performance, selecting the right category ensures you aren’t trying to measure bottom-line profit with top-of-funnel vanity metrics. We focus on using data to drive marketing decisions by matching tracking platforms directly to business models.
Different departments face distinct measurement challenges:
- Marketing & Growth Teams: Focus on multi-touch customer journeys, customer acquisition costs (CAC), and channel attribution. Free suites like the Marketing Calc Hub — Free Marketing ROI Calculators allow operators to quickly test basic return benchmarks.
- Engineering & IT Leadership: Evaluate tooling costs against developer time saved and deployment frequency.
- Operations & Field Services: Measure equipment downtime, labor capacity, material waste, and job profitability.
- Workforce & Training Programs: Track how skill development and apprenticeships offset recruiting overhead and boost retention.
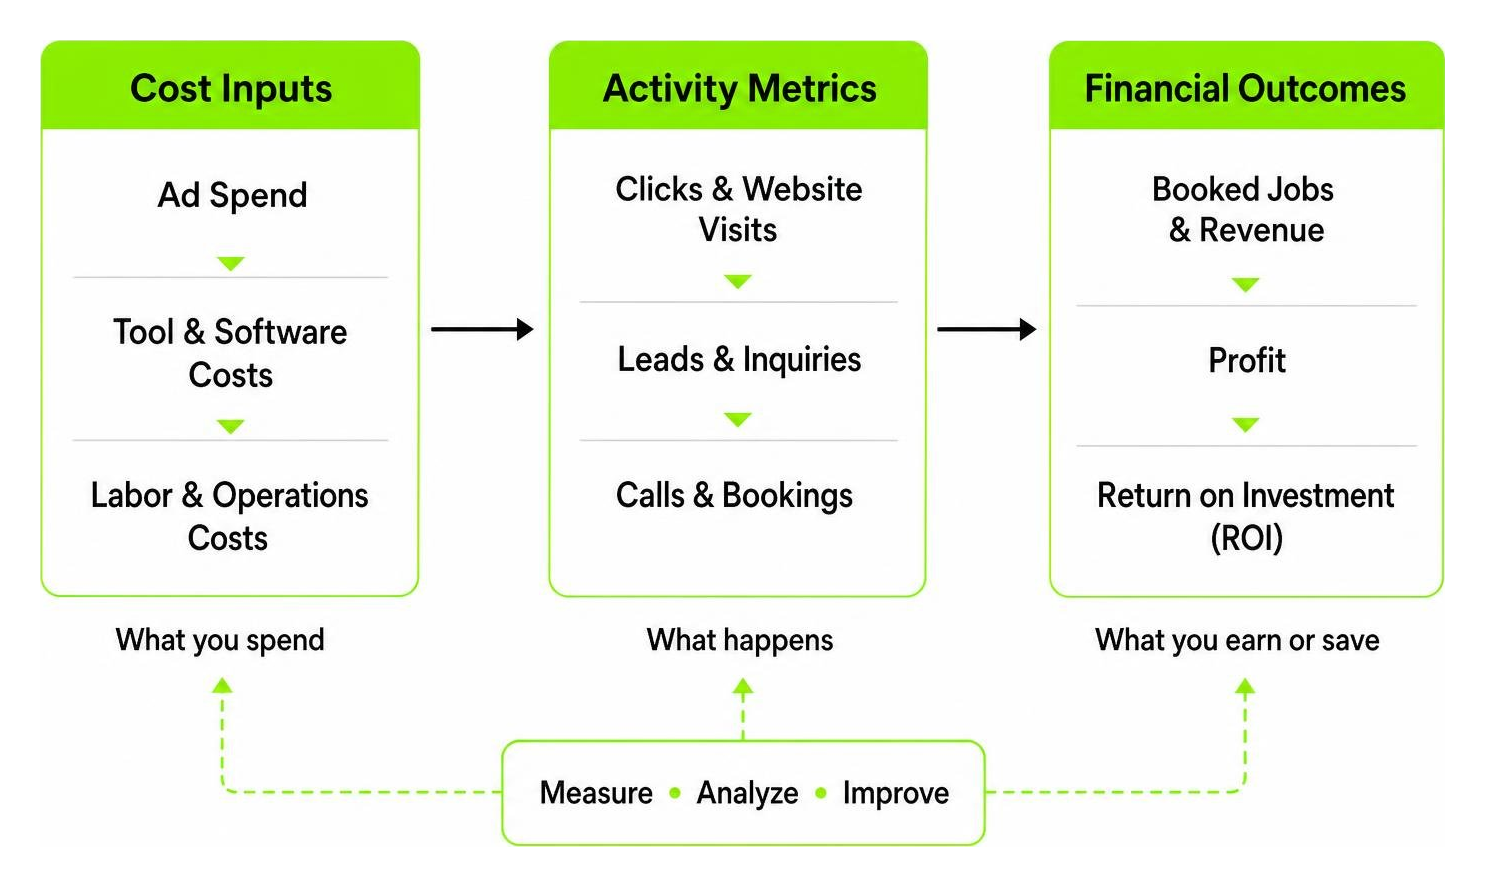
Marketing and Multi-Channel Attribution
Marketing platforms track ad spend across Google, Meta, local directories, and organic search, attempting to match clicks with converted customers. Basic setups rely on single-touch models—either crediting the very first ad a user saw (first-touch) or the final link they clicked before filling out a form (last-click).
Modern attribution software moves past last-click bias by linking ad clicks, forms, and phone calls to closed-won deals in your customer relationship management (CRM) software. Understanding your data begins with how to use UTM codes to track website performance, capturing traffic sources cleanly before passing customer journey data into conversion pathways. Combining this tracking with understanding conversion rate optimization ensures you improve on-page conversion rates while accurately measuring customer acquisition costs.
AI Implementation and Productivity ROI Tools
As businesses adopt generative tools, tracking technology expenses has become top of mind for finance teams. A 10,000-person enterprise paying $30 to $60 per seat each month for corporate AI assistants commits $3.6 million to $7.2 million annually in licensing fees alone.
Despite heavy adoption, enterprise measurement remains surface-level:
- GitHub Copilot reports suggestion acceptance rates between 27% and 30%, saving roughly 3.6 hours per developer each week.
- Most native tool dashboards track only seat activation and prompt volume.
- Fewer than one in three AI decision-makers can tie AI value directly to profit and loss (P&L) statements.
- 88% of organizations have adopted AI, yet only 39% can report any measurable earnings before interest and taxes (EBIT) impact.
Connecting technology usage to balance-sheet results requires modern telemetry. Advanced platforms, including GA4 the future of analytics, demonstrate how event-driven tracking architectures capture digital interactions to inform broader operational strategies.
Operational and Manufacturing Calculators
Operational calculators measure physical throughput, asset reliability, and workflow efficiencies. In industrial environments, unplanned equipment downtime can cost $100,000 per hour. Calculators designed for maintenance and logistics quantify preventive actions, overall labor effectiveness (OLE), cycle times, and scrap reduction.
Workforce investments also require objective financial analysis. The Alabama Apprenticeship ROI Calculator allows regional employers to project wage-to-productivity returns, showing how structured skills training generates measurable savings through reduced recruiting costs and increased employee retention.
Critical Limitations and Measurement Gaps in Standard Analytics

A major trap in performance tracking is confusing platform activity with actual enterprise profit. Roughly 57% of marketers still rely solely on raw lead volume to measure marketing success. However, form submissions and ringless clicks do not guarantee bankable revenue.
If your analytics platform cannot reconcile phone inquiries with completed service invoices, you risk scaling campaigns that generate unqualified noise. Implementing why call tracking is a must-have for local marketing bridges the gap between ad clicks and phone conversations, providing a concrete baseline for how to measure marketing success across every local channel.
Overstated Platform Incrementality
Ad network dashboards naturally claim maximum credit for every sale. Platform-reported conversions in Meta Ads Manager, Google Ads, and TikTok Ads consistently overstate incrementality by 40% to 70%.
This inflation happens because ad networks rely on view-through tracking windows and aggressive last-touch rules:
- View-Through Credit: If a customer browses your website, happens to scroll past an ad on social media without clicking, and later purchases directly, the ad platform takes full credit.
- Brand Search Overlap: Paid search campaigns capture customers who were already searching for your specific company name.
- Cookie Degradation: Privacy updates on mobile operating systems break deterministic browser tracking, forcing platforms to use modeled estimates that favor their own ad inventory.
To uncover true incremental lift, businesses run controlled geo-experiments and holdout tests—intentionally turning off paid channels in selected zip codes to measure whether overall revenue dips or remains steady.
Disconnect Between Activity and P&L Impact
Most analytics solutions suffer from a foundational architecture flaw: they track actions rather than financial outcomes.
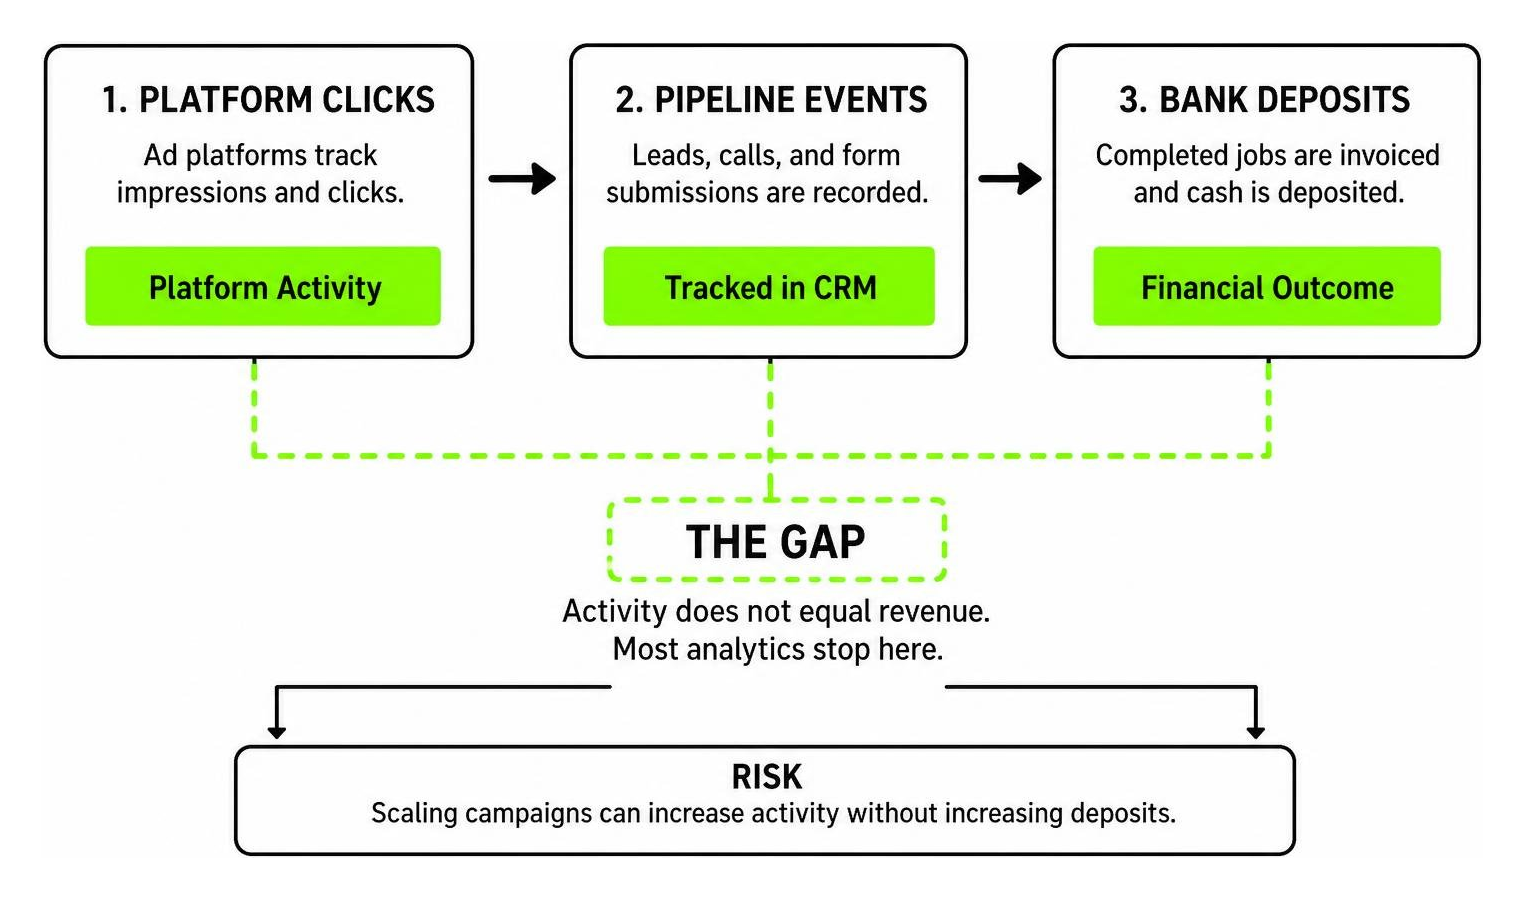
When organizations attempt to bridge this divide using custom enterprise business intelligence (BI) systems, costs climb rapidly. A custom BI dashboard implementation for a 5,000-person organization takes three to six months to deploy across multiple data sources, with first-year expenses running between $510,000 and $1.2 million. Without continuous data governance, these dashboards fail to reconcile lead numbers with actual accounting balances.
How to Choose the Right Measurement Framework for Your Team
Selecting an analytics platform requires matching software capabilities with your technical resources, sales cycle, and privacy standards. Applying smart ways to reduce PPC spending and boost ROI starts with eliminating channel-level data blind spots.
| Evaluation Metric | Free/Browser Calculators | Mid-Market Attribution Tools | Enterprise BI & Data Warehouses |
|---|---|---|---|
| Typical Cost | $0 | $200 – $1,500 / month | $500,000+ setup & licensing |
| Setup Time | Instant (under 2 minutes) | 1 to 3 weeks | 3 to 6 months |
| Data Ingestion | Manual operator inputs | Automated CRM & ad APIs | Custom data pipelines & SQL |
| Tracking Method | Estimated static formulas | Server-side & first-party IDs | Data lake warehouse syncing |
| Best Use Case | Fast unit-economic modeling | Lead-to-revenue tracking | Enterprise-wide P&L governance |
Key Features to Demand in ROI Tools
When evaluating software, demand capabilities that support strict financial accountability:
- Server-Side Tracking Pipelines: Browser-based tracking pixels lose significant conversion data due to ad blockers and browser privacy constraints. Server-side tracking sends conversion events directly from your server to analytics platforms, ensuring clean data collection.
- Deterministic Identity Resolution: The software must stitch together multi-device touchpoints—connecting initial mobile research, desktop form submissions, and direct phone calls into a single customer profile.
- Two-Way CRM Synchronization: Attribution platforms should push lead source data into your sales pipeline and pull closed revenue back into your reporting dashboards.
- Omnichannel Budget Optimization: Look for tools that evaluate performance across your entire marketing portfolio rather than evaluating channels in isolation, supporting your review of social media ROI statistics marketers need to know.
Justifying Budget Allocation to Executive Leadership
Financial executives speak in unit economics, capital efficiency, and payback timelines—not impressions, clicks, or click-through rates. When presenting performance data to leadership, anchor your business case in three core financial pillars:
- Fully Loaded Customer Acquisition Cost (Blended CAC): Factor in every dollar spent—media costs, agency retainers, internal labor, and software subscriptions. Dividing total revenue by ad spend alone creates a distorted picture of profitability.
- CAC Payback Period: Calculate the exact number of months required for a customer’s gross margin contribution to pay back the fully loaded cost of acquiring them. Healthy targets generally range between 12 and 18 months for contract models, or immediate breakeven on initial service dispatch calls.
- LTV to CAC Ratio: A healthy business maintains a customer lifetime value (LTV) to acquisition cost ratio of at least 3:1. Ratios approaching 5:1 indicate high capital efficiency with room to scale ad spend aggressively, while figures below 2:1 highlight unsustainable customer acquisition costs.
Frequently Asked Questions About ROI Measurement
What is the primary difference between ROI and ROAS?
Return on Ad Spend (ROAS) measures gross revenue generated directly per dollar of advertising spend. To calculate it, divide gross revenue from ads by direct ad spend.
Return on Investment (ROI) evaluates true bottom-line profitability by accounting for all business expenses. To calculate it, subtract total fully loaded costs from net revenue, divide that result by total fully loaded costs, and multiply by 100 to express it as a percentage.
ROAS can look exceptionally high on paper while your net margin remains negative if production costs, technician payroll, materials, and overhead are left out of the calculation.
Conclusion
Proving business impact requires moving past vanity metrics and adopting measurement tools that connect daily operational activities directly to bankable profit. When your tracking framework aligns ad spend, customer pipelines, and accounting data, budget allocation transforms from an educated guess into a predictable engine for business expansion.
At Fusion One Marketing, we eliminate the guesswork through our comprehensive Digital Domination program. We build integrated SEO, website, social, and PPC strategies backed by call tracking, lead validation, and revenue attribution to ensure every marketing dollar drives measurable growth for your business.